


News Center
All newsHow Do Clallam PUD Rates Compare?
Have you ever wondered how the residential electric rates of Clallam County PUD compare to those of surrounding utilities?
Of course you have, so let’s get right to the meat of this article.
 This article was originally printed in the 2015 1st Edition of HotLine.
The chart below shows your PUD’s residential electric rates as well as the rates of surrounding or nearby utilities. The math is fairly simple: we took a “typical size” load of 1500 kilowatt hours of energy use, multiplied it by the energy rate, and added in the basic charge (where applicable). Totals are rounded to the nearest dollar.
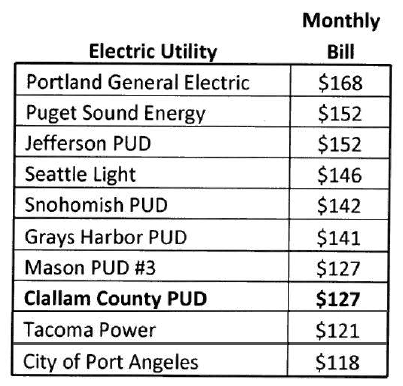
Source: All rate information, including energy charge and basic charge, were derived from the most current information on each utilities web site as of March 11, 2015. Some of the reasons for disparity in rates include the high population density of a city like Port Angeles compared to more rural services like Clallam PUD, and the need to satisfy shareholders profit demands (such as for PSE and Puget Sound Energy) compared to public power utility like Clallam PUD.
* It should also be noted that the City of Port Angeles benefits from being classified as a “small utility” and is thus not subject to the renewable energy and energy conservation mandates of the
Washington Energy Independence Act.
In the chart below, we show what your PUD’s April 2015 residential kWh electric rate is compared to that of the national average, Washington’s average, Oregon’s average, Idaho’s average, and California’s average as of December 2014.
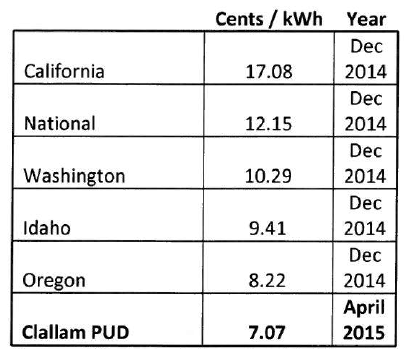
Source: U.S. Energy Information Administration’s Average Retail Price of Electricity to Ultimate Customers by End-Use Sector. Accessed www.eia.gov March 11, 2015.
Learn more about Clallam PUD Electric Rates by Clicking Here.